 Tofino City Guide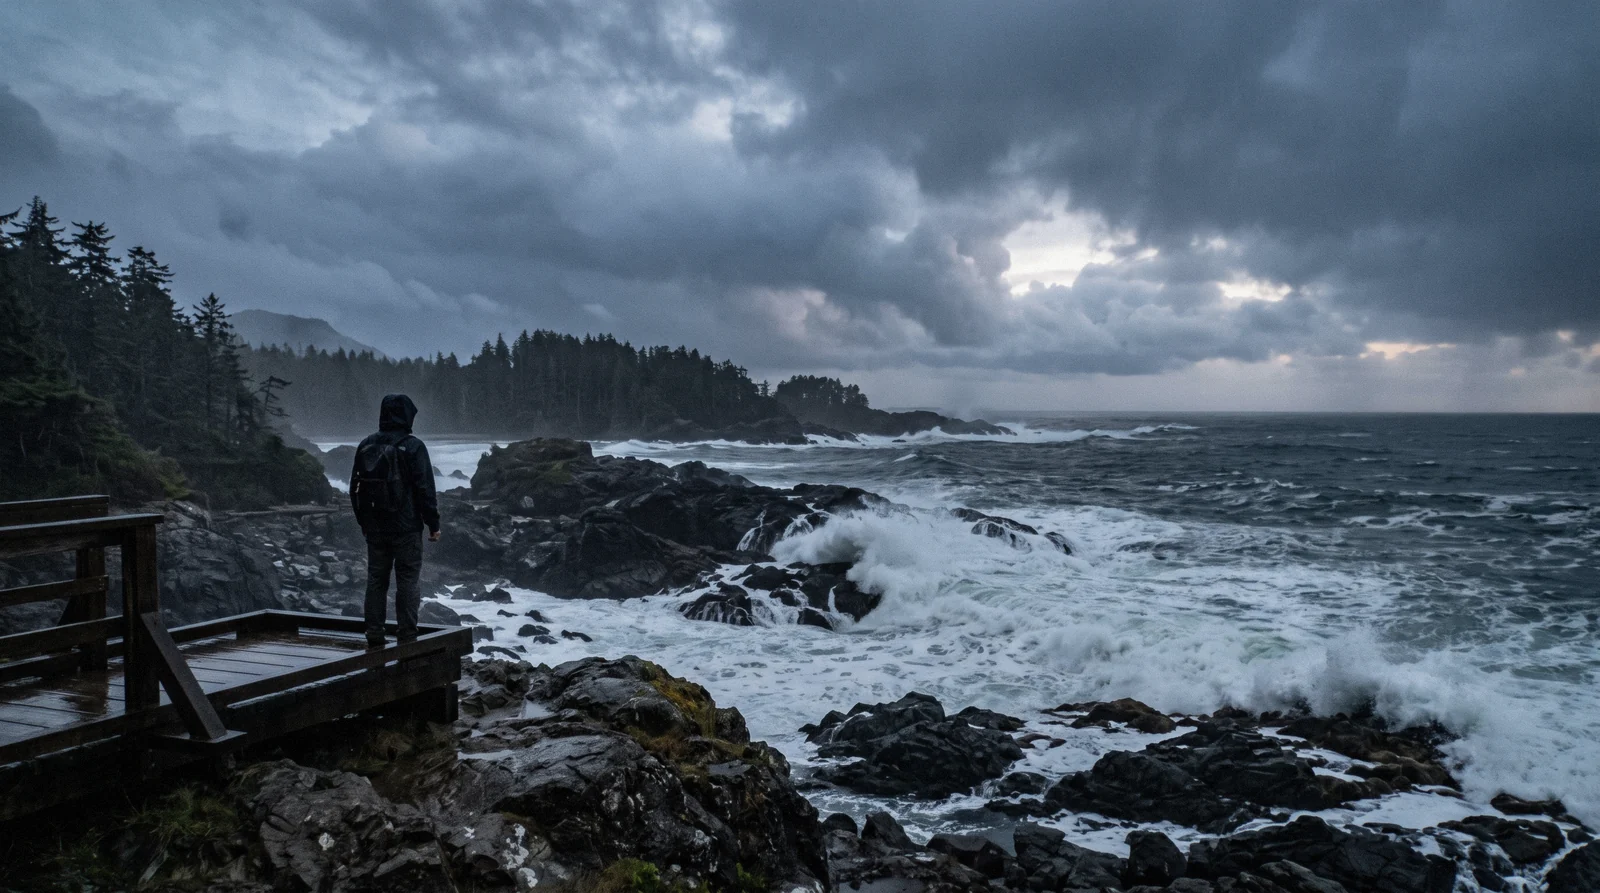
Tofino Weather: What To Expect All Year
Tofino weather is the single biggest factor in planning a trip to this coast. The town sits directly on the open Pacific, and the same ocean that draws surfers and storm watchers also delivers one of the wettest climates in Canada. This page sets out the Environment and Climate Change Canada normal for the Tofino A station, month by month, so you can see exactly how much rain falls, how warm it gets, and when the driest stretch of the year actually runs. For the seasonal decision built on top of these figures, see best time to visit Tofino, or start at the Tofino city guide for the rest of the trip.
Quick answer
Tofino gets about 3,270.7 mm of rain a year, and July is the driest month at 71.0 mm while November is the wettest at 492.1 mm. Summer highs reach around 19°C (66°F) in July and August, and winter highs sit near 8°C (47°F).
Key takeaways
- The driest and mildest window runs from June through September, which is why our best time to visit Tofino guide leans that way.
- Rain is not a reason to stay home. Our rainy day in Tofino list and storm watching guide cover the wet season properly.
- Every number on this page comes from the Canadian climate normal for the Tofino A station. Start at the Tofino city guide for everything else, or go straight to things to do in Tofino.
Tofino Weather By Month
This chart shows the average daily high for each month in Tofino, with the rainfall bands underneath so you can see how temperature and rain move together through the year. The figures come from the long term climate record, not a forecast.
Source: Environment and Climate Change Canada, Canadian Climate Normals 1981-2010, Tofino A station. No 1991-2020 normal is published for this station, so this 1981-2010 normal is the standing figure.
How Much It Rains, Month By Month
Rain is the defining fact of Tofino weather. The town sits on the west coast of Vancouver Island and the Pacific systems roll straight in. The yearly total of 3,270.7 mm puts it among the wettest recorded places in Canada, and the split between wet and dry seasons is sharp.
The Wet Season Runs October Through March
This is when Tofino earns its reputation. October opens the wet season with 341.9 mm. November is the wettest month of the year at 492.1 mm, December follows with 440.0 mm, and January brings 486.6 mm.
February and March ease back to 336.1 mm and 329.8 mm. Add those six months together and you get well over 2,400 mm, roughly three quarters of the annual total. In practice this means long stretches of grey skies, driving rain and the occasional violent storm.
Some travellers come precisely for that. The storms that hit the open Pacific crash onto the beaches here, and storm watching from a warm room is a real winter draw. If you visit in these months, plan around the rain rather than against it.
Waterproof layers matter more than umbrellas, which rarely survive the wind. It is also worth knowing the safety context. There have been no lifeguards on any Tofino beach since 2012, and winter seas and storm surf make that fact more serious, not less.
Our Tofino safety page covers beach and ocean safety in detail.
The Shoulder Months Soften The Edges
April and May mark the turn. April drops to 269.9 mm, which is still a wet month by most standards but a big improvement on winter. May falls again to 153.0 mm, and the days are getting longer and milder at the same time.
On the other side of summer, September records 132.8 mm, which keeps it firmly in the dry half of the year even though the autumn rains are not far off. These shoulder months are a reasonable compromise if you want fewer people without the full force of the wet season. You should still expect wet days.
A month with 153 mm of rain is drenched compared to most of Canada. The difference is that the rain tends to come in shorter spells, with breaks of calm and occasional sunshine between the fronts. May in particular often gives long daylight hours and quieter beaches before the summer season builds.
For a month by month decision that weighs crowds, prices and weather together, see our best time to visit Tofino guide.
Summer Is The Dry Stretch, By Tofino Standards
June, July and August are the driest months, and the drop is dramatic. June records 129.7 mm. July is the driest month of the year at 71.0 mm, and August stays low at 88.1 mm.
Those three figures are a small fraction of what November or January deliver. To put it plainly, July in Tofino is drier than plenty of places that never think about rain gear. That said, 71.0 mm still means some rainy days, and coastal fog is common in the mornings even when no rain falls.
The pattern in summer is often a misty start that burns off into a mild, clear afternoon. If you are here to surf, hike the beaches or take boats out on the water, this is the stretch when plans are least likely to be washed out. Pack a rain shell anyway.
It is part of the local wardrobe all year, and a clear July morning can still end in a shower. Our Tofino surfing page covers conditions in the surf season.
The Full Year, Month By Month
The chart above rounds the figures for readability. Here is the Tofino A station's 1981-2010 normal in full, average daily high, average daily low and total rainfall for every month, so you can check an exact figure for the month you are travelling in rather than reading it off a chart band. The year total is 3,270.7 mm of rain, against average highs that range from 8.1°C in December to 19.1°C in August.
| Month | Avg high °C | Avg low °C | Rain mm |
|---|---|---|---|
| January | 8.3 | 2.3 | 486.6 |
| February | 9.0 | 1.9 | 336.1 |
| March | 10.1 | 2.7 | 329.8 |
| April | 11.9 | 4.0 | 269.9 |
| May | 14.5 | 6.5 | 153.0 |
| June | 16.8 | 8.9 | 129.7 |
| July | 18.9 | 10.5 | 71.0 |
| August | 19.1 | 10.8 | 88.1 |
| September | 17.8 | 9.0 | 132.8 |
| October | 13.6 | 6.3 | 341.9 |
| November | 10.0 | 3.6 | 492.1 |
| December | 8.1 | 1.9 | 440.0 |
Source: Environment and Climate Change Canada, Canadian Climate Normals 1981-2010, Tofino A station.
Temperatures Through The Year
Tofino temperatures are mild for Canada. The ocean keeps the coast cool in summer and well above freezing in winter. Snow is rare and summer heat is gentle.
Summer: Mild Days, Cool Evenings
July and August are the warmest months, with average daily highs of 18.9°C and 19.1°C, which is about 66°F. That surprises visitors who expect Canadian summers to be hot. Tofino almost never swelters. The trade is comfort: warm enough for beach walks in a light layer, cool enough that a hike never becomes a struggle.
Nights drop to average lows of 10.5°C in July and 10.8°C in August, so you will want a fleece or jumper for evenings on the deck. June is slightly cooler with a 16.8°C high and an 8.9°C low, and September sits at 17.8°C and 9.0°C. All four of these months carry the year's most reliable weather and the year's smallest rain totals. The water itself is another matter.
No official water temperature figure is published in the climate record we rely on, so we will not quote one, but nobody swims here without a wetsuit and the surfers know it.
Winter: Wet But Not Bitter
Winter in Tofino is defined by rain, not cold. The average daily high in December is 8.1°C, in January 8.3°C and in February 9.0°C, so roughly 47 to 48°F. The average lows are 1.9°C in both December and February and 2.3°C in January, which means frost happens but deep cold rarely does. Snow is an event rather than a season, and when it falls it usually melts quickly.
This mildness is what makes winter visits workable. You can walk the beaches and watch storm systems arrive in conditions that are wet and windy but not dangerous to be out in, with sensible precautions. The winter lows also explain why Tofino never truly shuts down.
Restaurants and galleries stay open and the town keeps a low season rhythm. If the idea of watching a Pacific storm from behind glass appeals, our storm watching in Tofino guide covers where to do it and what to expect.
Spring And Autumn: The Slow Slide Both Ways
Spring builds steadily. March averages a high of 10.1°C and a low of 2.7°C. April reaches 11.9°C and 4.0°C. May gets to 14.5°C and 6.5°C. By late spring the days are long and the light is soft, which photographers in particular like. Autumn runs the film backwards.
September is still summery at 17.8°C and 9.0°C. October cools to 13.6°C and 6.3°C while the rain climbs to 341.9 mm. November lands at 10.0°C and 3.6°C with the year's heaviest rain at 492.1 mm. Packing for either season means the same kit as winter, a layer lighter.
A waterproof jacket, quick drying clothes and footwear that can handle mud and wet sand cover you from October through May. For the wet months, our rainy day ideas for Tofino page pulls together the indoor options, from galleries and cafes to museums and spas. For the full comparison of what each season offers beyond weather, our best time to visit Tofino guide lays it out.
What To Pack, In Short
One packing list covers most of the year here. Bring a proper waterproof jacket with a hood, because the wind makes umbrellas a losing bet outside the driest weeks. Bring layers, since a 19°C afternoon can follow a 10.8°C evening in the same July day. Bring waterproof footwear or boots you do not mind getting soaked, especially between October and March. A warm mid layer earns its space from September through May. Add a hat and gloves for winter beach walks, when wind off the Pacific makes 8°C feel sharper than the number suggests. Sun protection is worth a line too. Clear summer days on a wide open beach catch people out, even at 19°C. Finally, if you plan to surf or paddle, a wetsuit is non negotiable in any month, and rental shops in town handle that. If your dates are flexible and weather is your main concern, aim at the June to September window and cross check our best time to visit Tofino guide for the crowd and price trade offs.
One more point worth stating plainly: there is no month on this coast where you can leave the rain shell at home. Even July, the driest month at 71.0 mm, sees measurable rain on a meaningful number of days. The difference between January and July is one of degree, not of kind. Pack for a wet coastal climate every time you come, and treat a stretch of sunshine as a bonus rather than the baseline.
Fog And Overcast Skies, Not Just Rain
Rain totals do not capture the whole picture. Even on days with no measurable rainfall, this stretch of coast is prone to low cloud and morning fog, especially where the cool ocean current meets the warmer land air in the transition seasons. A grey sky in Tofino does not always mean rain is coming, and a clear morning does not guarantee a dry afternoon.
The climate normal used on this page tracks temperature and precipitation only, not cloud cover or fog frequency, so treat this paragraph as general coastal knowledge rather than a sourced statistic. The practical effect is the same regardless: pack for changeable conditions in every month, and do not judge the day by the first hour of it. Fog tends to burn off by late morning in the warmer months, which is part of why afternoons are the more reliable window for beach time or a boat trip in summer.
Tofino's Weather On Film
Two videos showing what the wettest months on this coast actually look like.
Storm Watching from the Wickaninnish Inn in Tofino
Storm watching from the Tofino shoreline during the wet winter months.
Video: Wickaninnish InnThe Wild Weather of Tofino, Canada
A look at the wild weather that defines Tofino's wet season.
Video: The Weather ChannelTofino Weather Questions
What is the rainiest month in Tofino?
November. The average November rainfall at the Tofino A station is 492.1 mm, the highest of any month. December follows at 440.0 mm and January at 486.6 mm, so the wettest stretch runs from late autumn deep into winter.
What is the driest month in Tofino?
July, with an average of 71.0 mm. August is nearly as dry at 88.1 mm and June at 129.7 mm. These three months are far drier than the rest of the year, though rain still falls.
Does it snow in Tofino?
Snowfall is not listed among the figures in the climate normal for the Tofino A station, so we cannot put a number on it. What the record does show is mild winter temperatures, with average daily lows of 1.9°C in December and February and 2.3°C in January, which is why snow rarely settles on the coast.
What is the warmest month in Tofino?
August, with an average daily high of 19.1°C, just ahead of July at 18.9°C. In Fahrenheit that is about 66°F. Evenings stay cool, with average lows near 10.8°C.
When is the best month for weather in Tofino?
July, judged purely on the record. It has the year's smallest rainfall at 71.0 mm and close to the warmest highs at 18.9°C (66°F). August is a close second. September is a good backup, with 132.8 mm of rain and a 17.8°C high. The full seasonal picture, including crowds and prices, is in our best time to visit Tofino guide.
How does Tofino weather compare across a typical week?
The climate normal gives monthly averages, not day-to-day variability, so a single week can run drier or wetter than the monthly figure suggests. In the wet months (October through March), expect several rainy days in most weeks, sometimes with the total for a single storm approaching a large share of the month's average. In the dry months (June through September), a week can pass with only a shower or two, though morning fog is common even then. Check a short-range forecast close to your travel dates for the week itself. This page gives you the pattern to plan around, not the forecast for a specific week.
We may earn a commission if you book through one of our links, at no extra cost to you. Full affiliate disclosure